What are KPIs and why are they important in Project Management?
KPI stands for Key Performance Indicators, i.e., your ability to measure and quantify any task.
I know many of you may say, "So what?" There is an old saying, “What We Can Measure, We Can Improve.”
Have you ever seen a car without a dashboard? Most obvious answer is, “No.” Then, why is there not a single car on the road without a dashboard? Because it reports the state of health of your car, such as the amount of fuel in the tank, how hot the engine is etc. Essentially, a dashboard is a proactive way to stay safe and maintain the car so accidents like getting stuck on the side of the road doesn’t happen because you ran out of gas.
Similarly, as a project delivery professional, you need to measure and monitor the health of your project. You need to accurately forecast when you will be able to deliver promised features to your users.
In my experience, one of the major factors why projects fail to deliver promised benefits is because critical stakeholders are NOT in the know of the health of their projects, hence, fail to take proactive actions to understand and fix issues impeding their project’s progress.
There are several KPIs that you can measure to assess the health of your project, but in my experience, there are a few that are must. For example, Release burndown chart, Sprint burndown, Sprint velocity, defect density, defect leakages, and backlog health.
For the purposes of this blog, I will focus on the Release burndown chart, which personally I find to be the foundational one to review first to evaluate the state of a project.
Release burndown chart:
As the name suggests, this chart tracks the rate of completion of user stories per sprint planned for the release. There are a few predecessor activities that must be completed before you start your project.
- First and foremost, you must decide what is more important to you- launch date or features available at launch. For example- If you were the product owner for the first release of the iPhone, what do you think would be more important- a.) releasing it on an announced date of June-2007 or b.) must wait till we can include iChat? You guess right, Apple released the iPhone-1 as planned on June 29, 2007 and since then have made several releases and enhancements. So, in this instance, time was a critical factor.
For the purpose of this blog, let’s assume that you are building a travel website, and you have 12 weeks to design, develop and launch it.
- So, the next important decision point is to finalize the duration of each iteration, i.e., sprints1– 1, 2, 3 or a 4 week iteration. In my experience 2 week sprints are the most effective. For our example, if we use a 2-week sprint, we have six (6) sprints. The number of sprints become our “X” axis.
- The third step has two sub-steps:
a) Prioritize the list of user stories2 that the team must work on first.
b) Calculate rough estimates of effort to complete them.
Effort can be measured in hours or story points3(SP). This will help you decide the size of the team to engage, i.e., total number of FTEs. For the purposes of this example let’s assume we must deliver 72 user stories (u/s) and the average u/s is 5 SP. This becomes your “Y” axis.
- The last step is to decide the team size. You have established that you only have 6 sprints to deliver 360 SP worth of work. This means you must engage (stand up) a team that can deliver 60 SP per sprint. Hence your team’s velocity4 = 60 SP.
Do we use a straight burn down method or actually plan stories we plan to complete in each sprint?
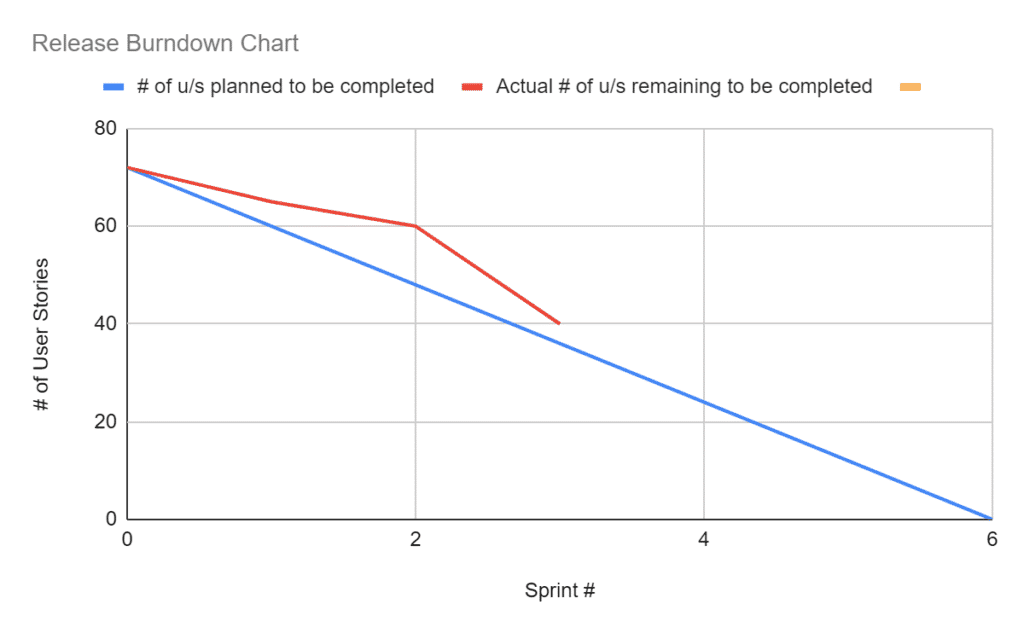
Viewpoint 1– If we have an existing team that has a proven track of delivery then I prefer to use a straight line method, e.g., in our above case, deliver 12 stories per sprint.
Example-1 | |||||||
Sprint # | 0 | 1 | 2 | 3 | 4 | 5 | 6 |
# of u/s planned to be completed | 72 | 60 | 48 | 36 | 24 | 12 | 0 |
Actual # of u/s completed | 72 | 65 | 60 | 40 |
(Table 1.1)

(Chart 1)
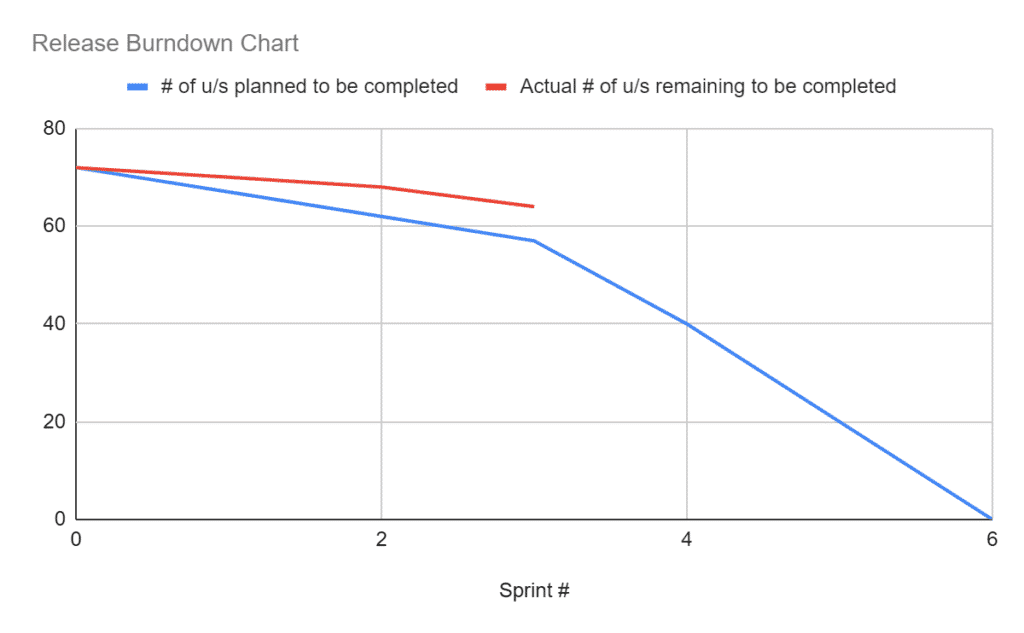
Viewpoint 2– if we are engaging a new team, which means there will be norming, storming, and forming, before performing then I prefer to use the ramp-up method as illustrated in the table (1.2) below.Sprint # | 0 | 1 | 2 | 3 | 4 | 5 | 6 |
# of u/s planned to be completed | 72 | 67 | 62 | 57 | 40 | 20 | 0 |
Actual # of u/s remaining to be completed | 72 | 70 | 68 | 64 |
(Table 1.2)

(Chart 2)
How to interpret the chart?In the first chart, we are behind our plan by 4 u/s, which equates to a variance of 6% (difference / total planned u/s, i.e., 4 / 72). Using the table 2, listed below, I will report that this project is in Amber state, i.e., they are behind but confident that the team can catch-up with little over-time.
In the 2nd chart, we are behind our plan by 7 u/s, which equates to a variance of 10% making its status Red.
Variance | RAG Status | Interpretation |
< 4% | Green | On-track to deliver as planned |
Between 4-8 % | Amber | At low risk- but confident that team will deliver |
>8% | Red | At major risk of missing delivery as planned |
(Table 2: variance values to assess the RAG status)
When we measure, we become aware. We find and fix issues that are slowing our teams. Therefore, it is important that you establish and communicate to the team the critical KPIs that they must collect and report. This will allow you to have a baseline plan to measure your true progress and actual stories planned vs. completed.
If you enjoyed reading this, please email me at cdevgun@cjdevgun.com and let me know what other project management areas you would like me to write about next.
1Sprint – each timebox iteration 2User Story- a description of a requirement 3Story points- a method for estimating work 4Velocity- amount of Story Points you deliver per sprint